Most large asset gains in bull markets occur in the early stages, in the first 12 to 18 months. However, by the time a big surge in the broad market indexes takes hold, many of the best stocks have been on the rise for weeks. The time is now, in the current bear market, to roll up our sleeves, do our homework, and follow the leaders.
How to spot leading stocks in a bear market
- 90+% of biggest winners emerge from market corrections
- Most of the best stocks bottom before the market bottoms
- Three spots to focus on: predictive, coincident, confirming
- Now in the bear market is the time to look for emerging leaders, new leadership
Over the last 140 years, the market shows that very little in the stock market is entirely new; history just keeps repeating itself. The stock market has been an effective leading indicator of the economy – both at peaks and troughs (Chart 1).
For the next part, which deals with leading stocks, we recommend our Notes From the Field on “Stock Price Maturation Cycle” and “Using accumulation and relative strength”.
After the wild ride of the most recent months, we are now looking for two key characteristics to spot new market leaders:
- Fundamentals that tell us what to buy
- Technicals that tell us when to buy
Fundamentals: Commonly, stocks that fare well during bear market corrections are in their own earnings cycle. These stocks may benefit from strong earnings and sales, new products or services, or changes in the industry that have a positive impact on the company.
Technicals: During corrections true market leading stocks exhibit strong relative price strength – they outperform. Their trend may be temporarily slowed or dampened by the weight of the bearish main trend of the general market. These stocks have lower correlation to the main index, remain resilient and quickly climb back to new highs.
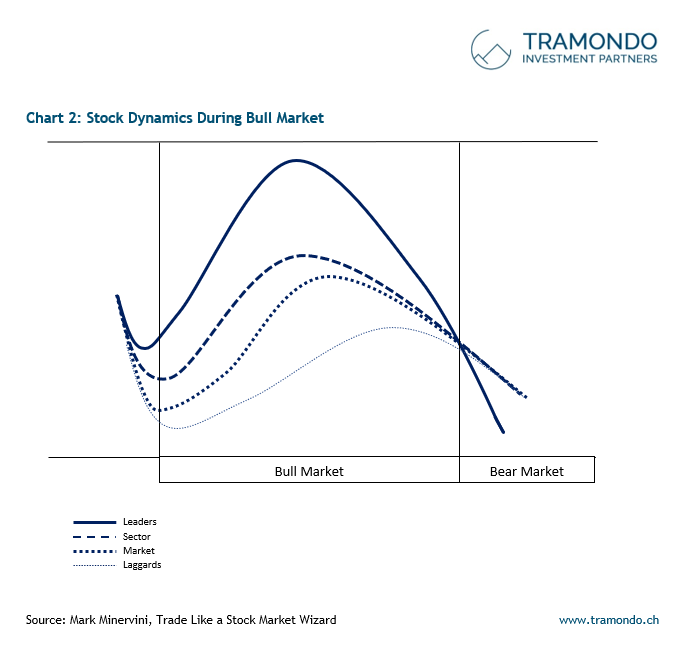
In our internal work, we combine the strong fundamentals (good story) with strong technicals (good chart) and look for stocks that make their lows before the absolute bottom of the market averages. Three points to focus on: predictive (Chart 2), coincident (Chart 3), confirming (Chart 4).
A new leading subsector (predictive phase) could emerge in solar energy (second strongest subsector out of 197), as shown by Enphase’s recent earnings results (Chart 5). Other subsectors that are of interest: medical/biotech and oil & gas.
Disclaimer: No investment advice. Do your own due diligence.
Was passiert mit wachstumsstarken/führenden Aktien und deren «Aushängeschild» $ARKK (Grafik 3), und warum?
Auf den Punkt gebracht, wie Mark Twain bekanntlich sagte: » Die Geschichte wiederholt sich nicht, aber sie reimt sich oft».
Aktienkurse von wachstumsstarken/führenden Aktien neigen dazu, einem so genannten «Aktienkurs-Reifezyklus» zu folgen – mit anderen Worten, es gibt vier Phasen im Leben einer Aktie (Grafik 1):
Phase 1: Basisbereich (Konsolidierung)
Phase 2: Aufstiegsphase (Akkumulation)
Phase 3: Hochphase (Ausschüttung)
Phase 4: Abschwungphase (Kapitulation)
Quelle: Stan Weinstein’s – Secrets for Profiting in Bull and Bear Markets
Darüber hinaus weisen führende Aktien in einem Bullenmarkt eine typische Zyklusdynamik auf, die aus einer Periode mit deutlicher Out- und Underperformance besteht (Grafik 2).
Wenn wir uns die Chartmuster der meisten wachstumsstarken/führenden Aktien seit März 2020 betrachten, befinden sich viele von ihnen bereits in Phase 4, nachdem sie in den letzten Monaten deutlich zugelegt haben und daraufhin ihren Höchststand erreicht hatten..
Für Tramondo ist die Beobachtung des Verhaltens von Leitaktien entscheidend für unser Absicherungskonzept und gehört zu unserer dritten Säule (von vier) «Marktinterna».