Most recently, we have witnessed a significant bear market in megatrend stocks and themes (cloud, fintech, artificial intelligence, millennials, digital health, cybersecurity, etc.) as well as in several high-quality companies such as Adobe or Partners Group.
Is there a regime change taking place from the old favorites to a different type of stock and theme, or is this just another great opportunity to buy the dips?
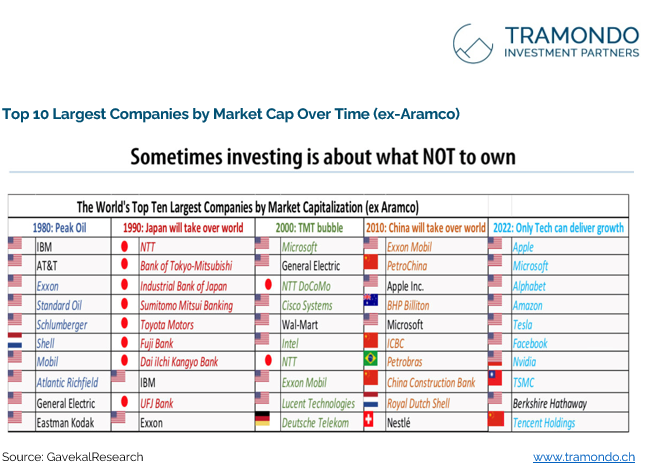
Over the last 140 years, the market shows that very little in the stock market is entirely new; history just keeps repeating itself. For example, out of 10 market-leading stocks, on average only one remains a true winner over the next business cycle (Chart 1). Hence, the only way to survive long-term is to be adaptive.
For the upcoming part focusing on accumulation and relative strength, we refer to our Notes From the Field regarding fundamentals (PE) and the stock price maturation cycle. In particular, our focus lies on Stage 1 (basing area) and Stage 2 (accumulation).
Finding new leaders during market corrections by using accumulation and relative strength
Bear markets, corrections, or price declines in the general market can help one recognize new powerful stocks – if we know what to look for:
- Technicals: Accumulation and relative strength. Accumulation is also known as institutional buying and is reflected in the daily volume of a stock. Institutional investors are what is known as “smart money.” Thousands of analysts and portfolio managers roll up their sleeves and conduct in-depth research on the companies they want to invest in. As they move very large sums of money, they unavoidably leave their footprints – accumulation – big volume buying. Distribution would be exactly the opposite. Relative strength is simply the change in price of the stock relative to an index (e.g., S&P 500) and reflects strength or weakness in relation to the chosen index.
- Fundamentals: Strong earnings and revenue growth (+ preferably earnings stability and a rock-solid balance sheet in terms of quality stocks).
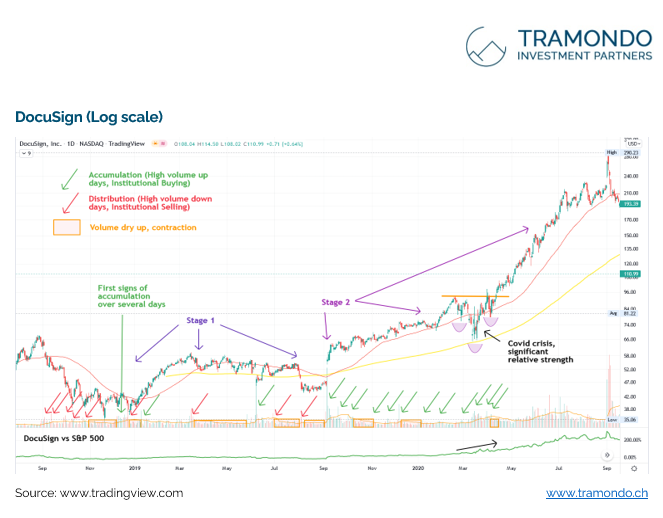
In a correction during a bull market or uptrend, the stocks that fall the least in percentage terms are usually the best choices. Those that fall the most are usually the weakest and should be neglected, no matter how rosy the fundamentals. Often, you do not know why the stock fell so much until later. In terms of fundamentals, before the 200% share price increase, DocuSign was posting triple-digit earnings and revenue growth at a P/E of 300+, while now it is the cheapest in comparison to its own history (P/E of 50) and is still posting triple-digit growth but is now down -60% from its all-time highs.
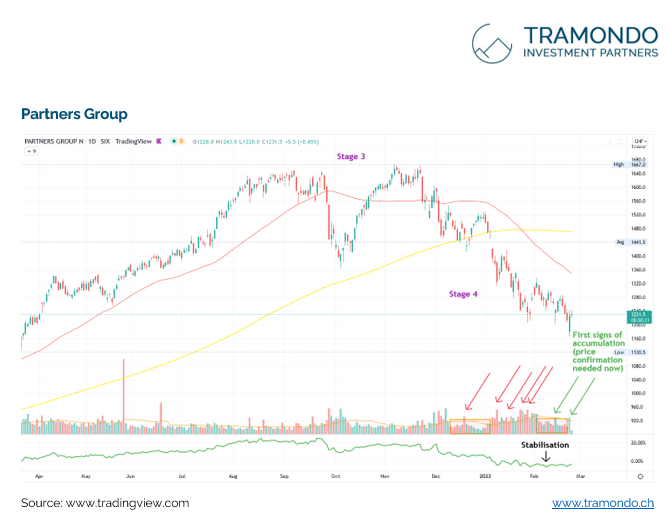
So, one glance is worth a thousand earnings forecasts .Study Chart 2 & Chart 3 for a minute. DocuSign was a prior super-performer while Partners Group might be in the first innings of a new accumulation phase. Any stock is inevitably in one of four market stages, and the trick is to be able to identify each one. (1) The basing area, (2) the advancing stage, (3) the top area and (4) the declining stage.
In this edition of “Notes from the Field”, we focus exclusively on the first two phases. After a stock has been declining for several weeks and months, it eventually loses its downward momentum and begins to trend sideways. To put differently, while sellers were much stronger initially, buyers and sellers start to move in equilibrium, thus price action starts to stabilize. When a base forms (consolidation), volume usually diminishes – liquidity dries up. However, volume often starts to increase late in Stage 1, even when prices are barely changing. This is an indication that stocks are no longer being run into the ground by disgruntled owners – exactly what we want to look for!
We look for stocks that are near the end of Stage 1 and moving into Stage 2 (e.g., also marked by both a rising 50- and 200-day moving average, respectively, as in the DocuSign example). In our portfolio, stocks that remain in a Stage 4 are gradually reduced over time. As data changes, we strive to adapt and adjust on an ongoing basis. Over time, we divest from laggards and invest the proceeds in newly emerging companies, reducing the opportunity cost of waiting months in a downward trending or consolidating stock while global markets provide new opportunities.
At Tramondo, we believe the only way to survive in the long-term is to be adaptive. In investing, we cannot direct the wind but we can adjust the sails.


